

Social media users and public figures alike have compared the numbers of deaths thus far in the COVID-19 pandemic to the number of deaths for other diseases for the past couple of months.
This is often done to downplay the severity of the pandemic.
However, the comparisons made are often apples to oranges and the data shared is often missing context or just flat incorrect.
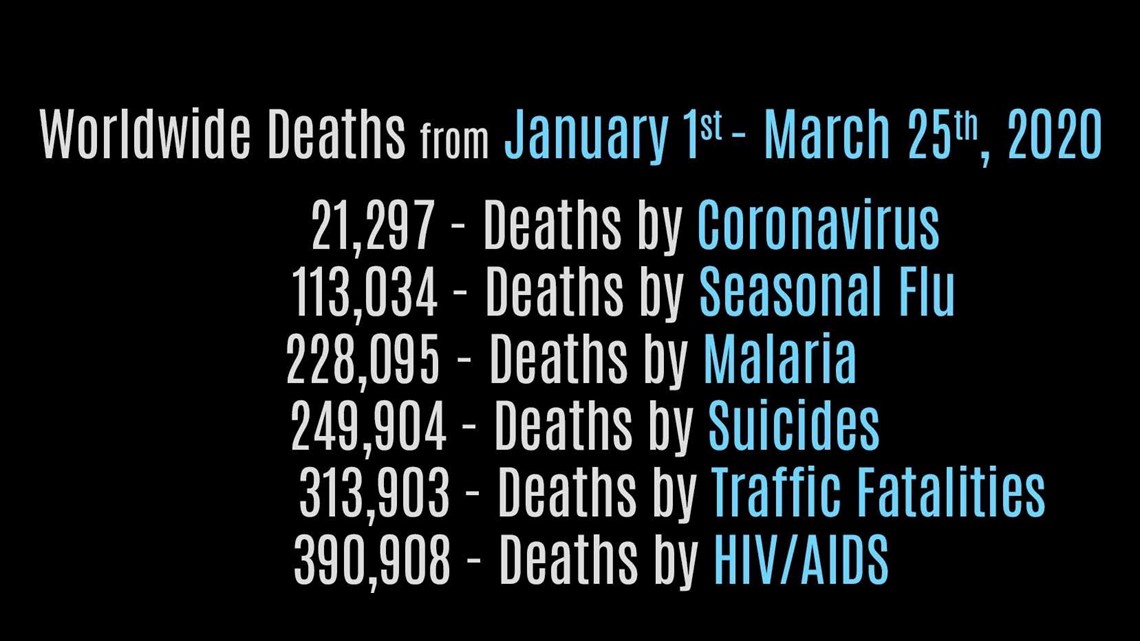
To show you what we mean, we took this image shared on social media and broke it down.

WHAT WE FOUND
First of all, it’s moot to even compare the number of COVID-19 deaths at this point to other kinds of causes of deaths. The numbers for most of these items are high, but fairly stable over time.
However, coronavirus deaths have been growing exponentially. That means each day the increase grows by a rate that becomes more rapid in proportion to the growing total number.
Let’s take a look at a few WHO situation reports as an example. On March 1, they reported there were 53 deaths in the last 24 hours. There were 862 deaths in the last 24 hours on March 16. There were 3215 new deaths in the last 24 hours according to the most recent situation report on March 30.
This matches the trend in numbers of total new cases. A graph of total cases day-by-day is shown in the bottom right of Johns Hopkins’ coronavirus data map. The graph shows how there are many more new cases per day now than there were near the beginning of March.
But are the numbers shown at least correct? Well, not necessarily.
These statistics aren’t tracked on a weekly basis globally. Instead, you have to estimate based on previous annual totals or estimates.
For example, the World Health Organization estimates there are between 290,000 and 650,000 flu deaths each year. They don’t track the exact total annually and made this estimate in December 2017. Nonetheless, if you make an estimate of what that would look like 85 days into a 366 day year, there would be between 67,350 and 150,956 deaths to the flu at this point in the year. The number shown above falls in that range, but it’s important to note just how wide that range is.
Not every number shown in the picture falls in the estimated range, however. Take the last number: 390,908 deaths to HIV/AIDS. The last annual estimate we have to work with is the 2018 numbers when somewhere between 570,000 and 1,100,000 died from AIDS-related illnesses, according to UN AIDS. That should be between 132,377 and 255,464 deaths when translated to just 85 days. That’s well under the figure given in the meme.
BOTTOM LINE
If you're going to try and compare COVID-19’s death toll to most other common causes of deaths, you need to include context. The figures surrounding coronavirus have grown exponentially, while the other causes of deaths are generally estimated on an annual basis.
In the graphic we found on social media, most of the numbers outside COVID-19 were estimates using total yearly numbers from the past. Those numbers aren’t always accurate -- especially when given without a linked source.
Something you’d like VERIFIED? Click here to submit your story