
AUSTIN, Texas — Editor's note: The video published above is a KVUE report about the number of UT students who had tested positive for COVID-19 prior to game day and thus were not allowed to attend.
When Gov. Greg Abbott reopened the Texas economy during the months of May and June, the positivity rate in the State of Texas was higher than was being reported at the time, according to new data.
The Texas Department of State Health Services (DSHS) announced on Monday a new process for how the agency reports the State's positivity rate. Abbott has mentioned the positivity rate as a key indicator of his decisions in closing and reopening the Texas economy.
Before, the State calculated the positivity rate based on the seven-day average of when the positive or negative result was reported by public officials. Now, the State has changed its process and is calculating the positivity rate based on the day the test was given, which state officials say provides a more accurate figure but can lag a few weeks behind.
According to DSHS, the State has changed how it calculates the positivity rate because "an influx of older test results in August caused new cases and new test results to get out of sync, leading to large swings in the positivity rate and the need to reevaluate methods to calculate it."
The State's old methodology suggested the positivity rate spiked from 12.05% on July 31 to 24.5% on Aug. 11. According to the new methodology, the positivity rate has been on a steady decline since July 7.
“These enhancements are part of our continuous effort to improve the information we present,” Dr. John Hellerstedt, the agency’s commissioner, said in a statement. “As the COVID-19 pandemic evolves, so must the data we share. Our information must provide the clearest possible picture of what is happening now and what has occurred in the past. The trends in this and other data shape our understanding of what to expect in the future.”
However, the agency's updated reporting method reveals that the State’s positivity rate was 7% through much of May as Texas began to reopen, higher than the rate of 4% to 6% that health officials reported at the time.
Phase 2 of Abbott's reopening came on May 18, which allowed for the reopening of bars, child care facilities, bingo halls and more. According to the dashboard, the reported positivity rate using the old methodology then was 4.47%. The agency's new method suggests the rate was actually 6.99% on May 18.
Throughout June and in early July, the positivity rate skyrocketed. According to the dashboard, the reported positivity rate using the old methodology peaked in July at 17.43%. The agency's new method suggests the rate actually peaked in July at 20.8%.

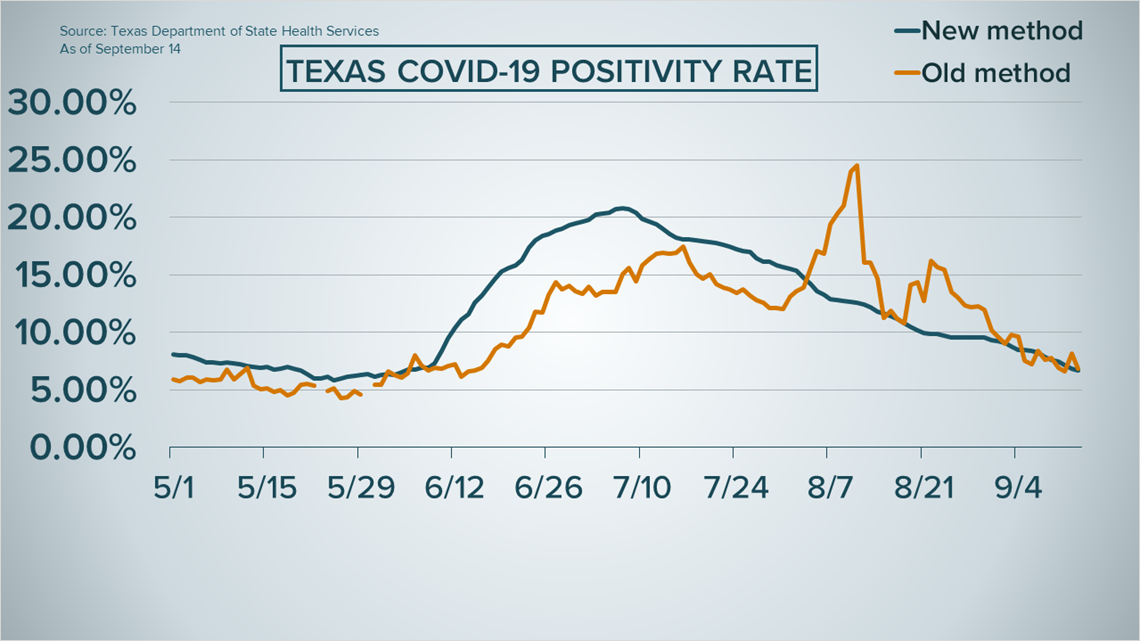
Abbott ordered bars to close and dialed back restaurant capacity to 50% on June 25. On June 26, the reported positivity rate using the old methodology was 13.23%, up from 11.73% one day prior when Abbott made the announcement. The agency's new methodology suggests the positivity rate at the time would have been 18.5%.
DSHS said in a press release it would continue to post the data for both processes on its online dashboard. The department also announced it was posting a positivity rate based on when lab results were reported to the state.
So, there will be three data points on the State's online dashboard moving forward:
- Specimen collection: the calculated positivity rate based on the date the person is tested
- Lab reported: the calculated positivity rate based on the date DSHS received the test result
- Case reported (the number you are used to seeing): the calculated positivity rate based on the date public health officials send data to DSHS
Which number should I pay attention to?
All of this may give you sensory overload, which is understandable. Some of you may be asking, "Which of these three numbers should I look at?"
Well, DSHS said the line known as the “specimen collection date” is the most accurate display of the positivity rate. However, the new method will take longer for the data to become complete, so the seven-day rolling average may change day-to-day as additional results are received for a particular day.
As of Sept. 15, the State's reported positivity rate for the graph's latest data point, Sept. 13, was 6.71%.
PEOPLE ARE ALSO READING: